File:Yardstick - Figure 7.jpeg
Jump to navigation
Jump to search

Size of this preview: 800 × 600 pixels. Other resolutions: 320 × 240 pixels | 1,200 × 900 pixels.
Original file (1,200 × 900 pixels, file size: 90 KB, MIME type: image/jpeg)
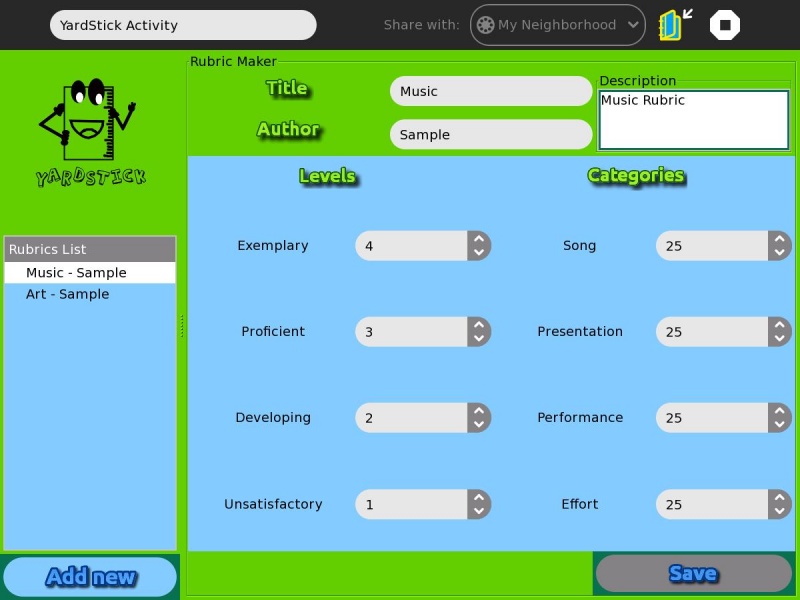
Figure 7 shows how to add numerical weights in a rubric. At the left side, we can see the levels of the rubric. At each level, the user needs to assign specific points for that level. Then for each category, the user needs to add the percentage of that category in a rubric. This will imply that the categories’ percentages should sum to 100. Table 1 shows a sample computation of the results after peer assessment. The following values are the tallies of votes gained in each level per category.
File history
Click on a date/time to view the file as it appeared at that time.
| Date/Time | Thumbnail | Dimensions | User | Comment | |
|---|---|---|---|---|---|
| current | 17:27, 17 May 2012 | | 1,200 × 900 (90 KB) | Almira Cayetano (talk | contribs) | Figure 7 shows how to add numerical weights in a rubric. At the left side, we can see the levels of the rubric. At each level, the user needs to assign specific points for that level. Then for each category, the user needs to add the percentage of that ca |
You cannot overwrite this file.
File usage
The following page uses this file: