Activities/Chart
Jump to navigation
Jump to search
The printable version is no longer supported and may have rendering errors. Please update your browser bookmarks and please use the default browser print function instead.
About
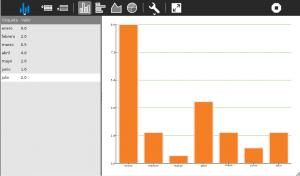
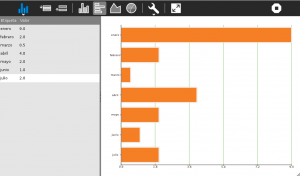
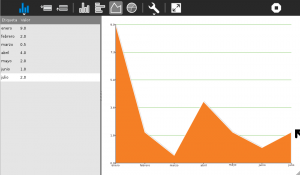
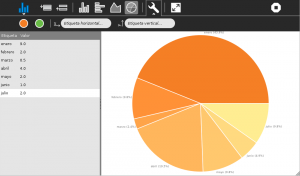
SimpleGraph lets you do graphical representation of simple tabular data, in the form "label: value". It can draw bar charts, line charts, and pie charts.
Development
Git repository:
http://git.sugarlabs.org//simplegraph
SimpleGraph uses PyCHA library:
https://bitbucket.org/lgs/pycha
Pending tasks to release version 1
- Add a fullscreen button so you can view your graph without the toolbars | DONE
- Change the gear icon to the spanner icon (the gear is for making
changes to the program, e.g., adding a new graph type; the spanner is for changing parameters) | DONE
- Move the colors, labels to a subtoolbar. I like the way they can
be hidden, but if you resize the panel, they become hard to use.On a toolbar, they'd always be the same size and would not interfere with the data entry | DONE
- Check fonts size in the charts | This is a PyCha error
- Remove pop-up alert when data is not valid | DONE
- Change chart tooltips, "Create pie chart" to "Pie Chart" | DONE
Ideas for future releases
- Interoperability with other activities, Measure, StopWatch
- Show a help tutorial when activity is started from scratch
- Share, edit the data with your friends
- Check if we can create the image without using one (or several) tempfile/s.


