Activities/Chart: Difference between revisions
Appearance
| Line 8: | Line 8: | ||
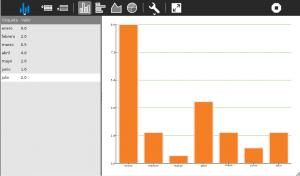
[[File:Simplegraph2.png|300px]] | [[File:Simplegraph2.png|300px]] | ||
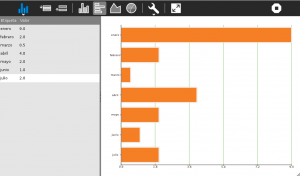
[[File:Simplegraph3.png|300px]] | [[File:Simplegraph3.png|300px]] | ||
== Donwnload == | |||
Download from ASLO: LINK HERE | |||
== Development == | == Development == | ||
Revision as of 07:20, 7 February 2012
About
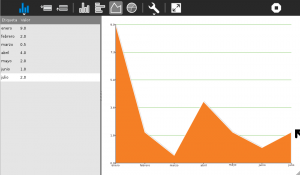
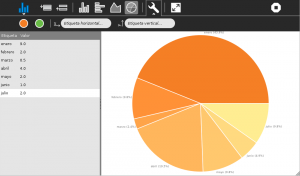
SimpleGraph lets you do graphical representation of simple tabular data, in the form "label: value". It can draw bar charts, line charts, and pie charts.
Donwnload
Download from ASLO: LINK HERE
Development
Git repository:
http://git.sugarlabs.org//simplegraph
SimpleGraph uses PyCHA library:
https://bitbucket.org/lgs/pycha
Pending tasks to release version 1
- Add a fullscreen button so you can view your graph without the toolbars | DONE
- Change the gear icon to the spanner icon (the gear is for making
changes to the program, e.g., adding a new graph type; the spanner is for changing parameters) | DONE
- Move the colors, labels to a subtoolbar. I like the way they can
be hidden, but if you resize the panel, they become hard to use.On a toolbar, they'd always be the same size and would not interfere with the data entry | DONE
- Check fonts size in the charts | This is a PyCha error
- Remove pop-up alert when data is not valid | DONE
- Change chart tooltips, "Create pie chart" to "Pie Chart" | DONE
Ideas for future releases
- Interoperability with other activities, Measure, StopWatch
- Show a help tutorial when activity is started from scratch
- Share, edit the data with your friends
- Check if we can create the image without using one (or several) tempfile/s.


