Difference between revisions of "Summer of Code/2016/Nutritional Microworld"
| Line 106: | Line 106: | ||
Along with the activities of beginner mode this will help user to do personalized activities. To make the activity personalized this mode stores user data(like identity, physical bio-data etc). | Along with the activities of beginner mode this will help user to do personalized activities. To make the activity personalized this mode stores user data(like identity, physical bio-data etc). | ||
This mainly consists of two types of activities : | This mainly consists of two types of activities : | ||
| + | |||
<b>i) Activity Planner:</b> | <b>i) Activity Planner:</b> | ||
| Line 113: | Line 114: | ||
[[File:N4.png|border|center|900x600px]] | [[File:N4.png|border|center|900x600px]] | ||
| + | |||
<b>ii) Analytics :</b> | <b>ii) Analytics :</b> | ||
User will be able to graphical analysis of his activities (food related activity and exercise related activities) in this module. User can choose whatever type of graph/chart he wants to plot, parameters on which he wants to plot, etc. User will be able to modify everything related to graph (like color, scaling-x , scaling-y etc.). Multiple dataset can be plotted on the same graph. For instance, he may plot graph of multiple nutrients he has taken, graph of calorie gain and calorie burned, also he may select datasets from his goals etc. From the example given below, user wants to plot a line graph of “Calorie burn” subgoal from his goal named “XYZ” (Goal contains subgoals) and actual calorie burn. | User will be able to graphical analysis of his activities (food related activity and exercise related activities) in this module. User can choose whatever type of graph/chart he wants to plot, parameters on which he wants to plot, etc. User will be able to modify everything related to graph (like color, scaling-x , scaling-y etc.). Multiple dataset can be plotted on the same graph. For instance, he may plot graph of multiple nutrients he has taken, graph of calorie gain and calorie burned, also he may select datasets from his goals etc. From the example given below, user wants to plot a line graph of “Calorie burn” subgoal from his goal named “XYZ” (Goal contains subgoals) and actual calorie burn. | ||
Revision as of 01:22, 25 March 2016
About me
What is your name?
My name is Sneh Gupta, and I am a 3rd year undergraduate student at IIIT-Hyderabad.
What is your email address?
snehgupta42@gmail.com
What is your Sugar Labs wiki username?
Snehgupta
What is your IRC nickname on irc.freenode.net?
Sneh1234
What is your first language? (We have mentors who speak multiple languages and can match you with one of them if you'd prefer.)
My first language is Hindi, I am fluent in English.
Where are you located, and what hours (UTC) do you tend to work? (We also try to match mentors by general time zone if possible.)
Location: Hyderabad, Telangana, India
Time Zone: UTC + 5:30 (Indian Standard Time)
Working hours: (UTC + 5:30) 15:00 - 18:00 and 21:00 - 2:00
Have you participated in an open-source project before? If so, please send us URLs to your profile pages for those projects, or some other demonstration of the work that you have done in open-source. If not, why do you want to work on an open-source project this summer
I have been a part of sugar since January this year. This is my first time contributing to an open source organization, but so far I am really enjoying the experience. Ever since I started exploring the world of open source, I have been mesmerised by the simplicity and the noble intentions behind the work that is being done. Sugar labs in particular has grabbed my attention so far because of OLPC program. It is a great initiative, and I want to contribute in whatever way I can to it.
About my project
What is the name of your project?
Nutritional Microworld.
Describe your project in 10-20 sentences. What are you making? Who are you making it for, and why do they need it? What technologies (programming languages, etc.) will you be using?
The project Nutritional Microworld is for children to learn the fundamental concepts of nutrition. Children life nowadays is quite different that they tend to have an unhealthy lifestyle . By playing with nutrition microworld, children will be able to learn the concepts of nutrition in a fun and interactive manner.
This project is analogous to turtle-blocks. By utilising block programming children will be able to do a lot of new things.
I have made a basic UX design for each type of activity.
Nutrition Microworld can be a bit overwhelming for the beginners. So Nutrition microworld can be used in two different modes.
i) In Beginner mode user will have access to a limited set of functionality.
ii) In advanced mode extra functionality will be added to the beginner mode.
Beginner Mode -
On the basis of functionality we have three different types of activities :
i) Food related activity :
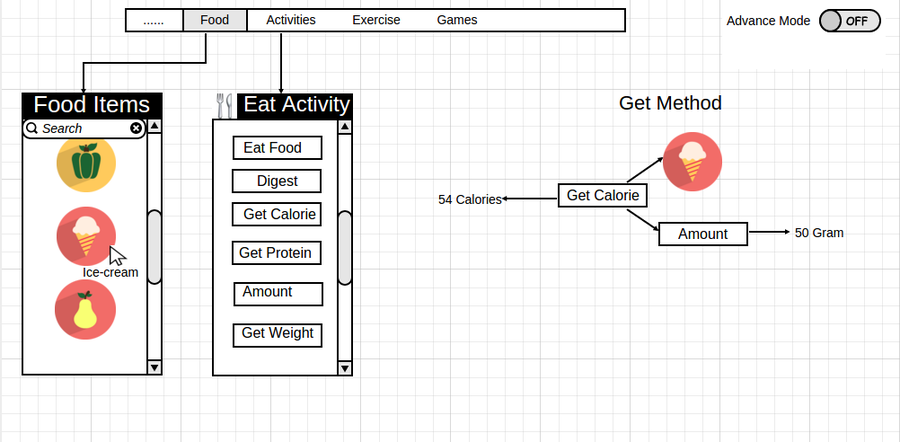
In this activity section user can select food items. The food items will contain images as well as nutrient information along with them. In this module, activities related to food items are present. For instance in the example below “Get calorie” method would take two arguments ice-cream and amount of it. Thereby returning the calories gained from it.
ii) Exercise related activity :
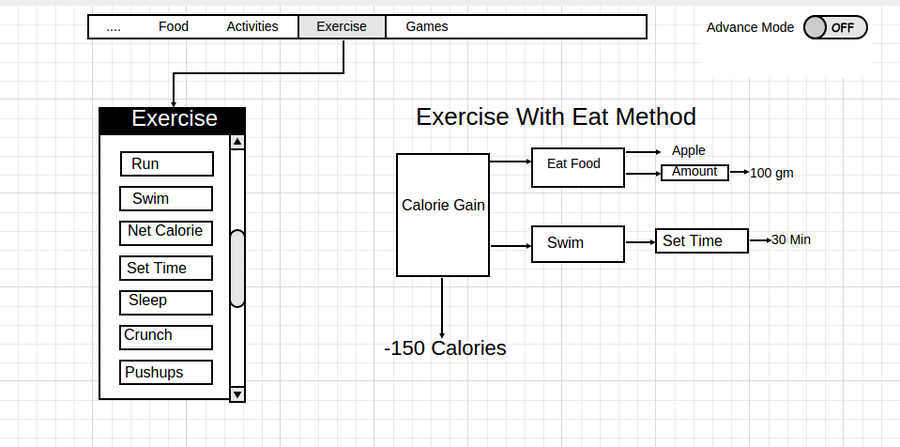
This section would contains different types of exercises. User can use exercise activities in conjunction with food related activities to get better understanding of how nutrition is related to exercise. For instance, as can be seen from the diagram below, the calorie gain block would return the net calorie. For example, here it is used to find the net caloric gain after eating a piece of apple and swimming for 30 min. Since 100 gm of apple would give approximately 50 calories and swimming for 30 min causes approximately 200 calorie to burned. Thus, the net caloric gain would be -150 calories.
iii) Games :
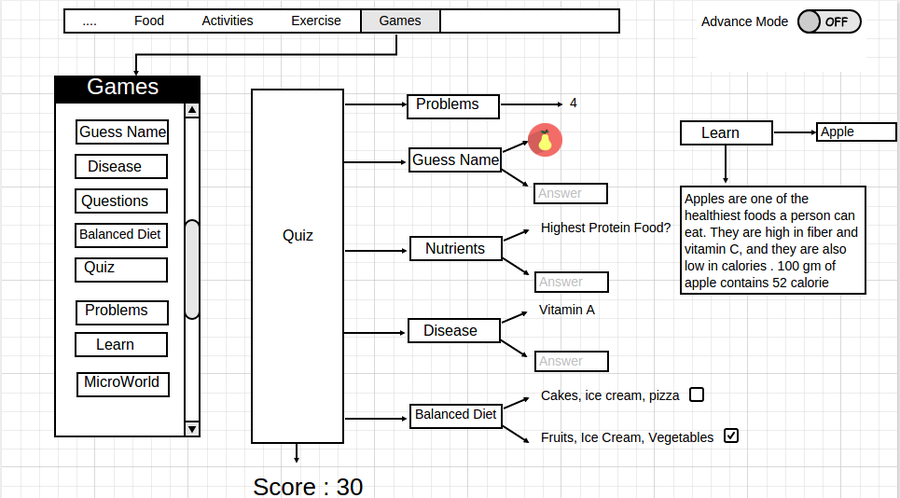
With the games activity, getting through these things and understanding the concepts of nutrition will be more easier and interactive. There will be some interesting quiz problems. User will be able to set the number of problems he wants to solve. And then he can choose those problems that he wants to solve. Below are some game examples user can play:
1) Guess the item - In this game user will have to find the correct name of the given food item. For example, here the image of guava is shown and now user have to write its name in the text field.
2) Nutrients Problem - In this game user will have to answer some question related to nutrients. For example, which food has highest protein content? Now user have to write the answer in the text field.
3) Disease Problem - In this game user will have to find which nutrient is related to given disease and vice - versa. For example, here vitamin A is given as one of the argument now user have to write the name of disease which is caused by lack of Vitamin A that is “Night Blindness”.
4) Balance Diet - In this game user will have to select which diet is better. User can do this by analysis of the nutrients. In the example below, two possible diets are given and second diet is better as it contains more nutrients than the first diet.
Similarly many more games can be created. Above games are simply based on block programming. Also, a learning section will be there to get the basic information about any food item, nutrient etc. For example, here apple is given as an argument to ‘Learn’ method and it outputs information about apple.
Advanced Mode -
Along with the activities of beginner mode this will help user to do personalized activities. To make the activity personalized this mode stores user data(like identity, physical bio-data etc). This mainly consists of two types of activities :
i) Activity Planner:
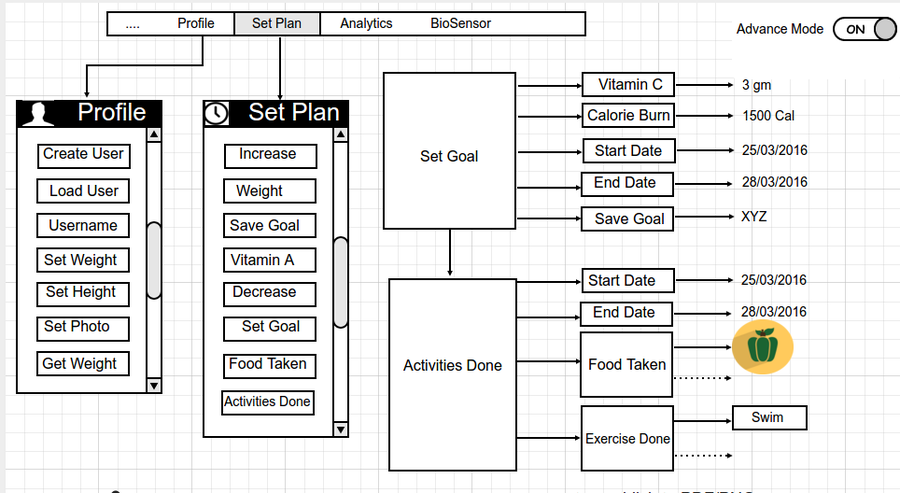
For this activity user have to load his personal identity. As can be seen below, User can do this by simply creating user by “Create User” block and set his personal bio-data. And then directly load user by “Load User” block by giving username as the argument. Here, user can set his/her plans regarding health related activities. As described below user can set his goal by “Set Goal” blocks which can consists of multiple plans (for example he will burn this much calorie, he will take this much Vitamin A, etc.) and by “Activities Done” block user can do entry of his activities from Start date to end date (given in argument). The below UX diagram shows that user set his goal "XYZ" in that he plans to burn 1500 Cal and take 3gm of Vitamin C from 25/08/16 to 28/08/16 and then he can use “Activities Done” block to simply keep track of the food items he ate and exercise done from 25/03/2016 to 28/08/16. Activities done will store the log of a given duration in database.
ii) Analytics :
User will be able to graphical analysis of his activities (food related activity and exercise related activities) in this module. User can choose whatever type of graph/chart he wants to plot, parameters on which he wants to plot, etc. User will be able to modify everything related to graph (like color, scaling-x , scaling-y etc.). Multiple dataset can be plotted on the same graph. For instance, he may plot graph of multiple nutrients he has taken, graph of calorie gain and calorie burned, also he may select datasets from his goals etc. From the example given below, user wants to plot a line graph of “Calorie burn” subgoal from his goal named “XYZ” (Goal contains subgoals) and actual calorie burn.


