Difference between revisions of "User:Tonyforster"
Tonyforster (talk | contribs) |
Tonyforster (talk | contribs) |
||
| Line 42: | Line 42: | ||
== Text-less outdoor lesson == | == Text-less outdoor lesson == | ||
| − | [[File:Outdoor-TA.jpg]] | + | [[File:Outdoor-TA.jpg|400px]] |
== Sliderule == | == Sliderule == | ||
Revision as of 18:40, 24 September 2010
http://tonyforster.blogspot.com/
forster at ozonline dot com dot au
Interests: Activities which maximise the opportunity for self-directed learning: low floor, wide walls and high ceiling with particular emphasis on the walls and ceiling. My favourites: turtleart, scratch, etoys.
Currently user testing turtleart and Sliderule
Preschool student Activities
Radia Perlman in the 70s when at student at MIT did extensive experiments with preliterate children and the LOGO turtle and built a number of interfaces for them. She also spent some time at Xerox PARC and did many similar experiments with chldren 3 years on up.
http://www.formatex.org/micte2006/virtual/pdf/582.pdf
see fig 3 with plastic cards showing visual images of turtle commands
http://www.formatex.org/micte2006/virtual/ppt/582.ppt similar image
http://logothings.wikispaces.com/ towards the end, photo of Radia Perlman's Button Box for Pre-Schoolers
http://alumni.media.mit.edu/~mcnerney/personal-ubicomp.pdf more discussion than the above
Turtle Art - text free
To what extent could pre-literate children use Turtle Art?
Are graphics on blocks really better than text?
Does keeping text labels help develop literacy?
What graphics are best?
Some features, eg. the heap are unlikely to be used by pre-literate children, should they be omitted or retained with text labels?
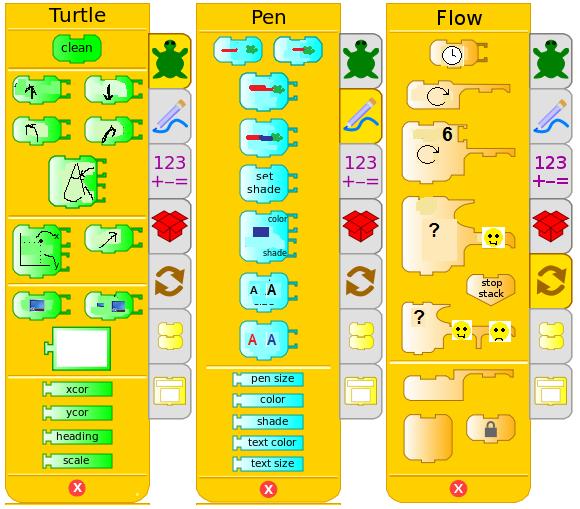
The following graphic is a discussion starter
or another [suggested layout]
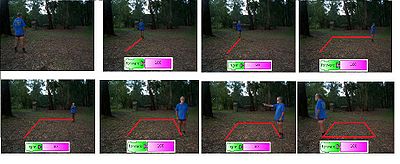
Text-less outdoor lesson
Sliderule
- http://tonyforster.blogspot.com/2010/09/pippy-sliderule.html Pippy File:Pippy sliderule.doc
- http://tonyforster.blogspot.com/2010/09/turtle-sliderule.html Turtle art
- http://www.freewebs.com/schoolgamemaker/#lobject Game maker
- File:Slideruletute.pdf tutorial
Software Freedom Day Melbourne 2010
File:Softwarefreedomday10.pdf presentation
http://luv.asn.au/sfd2010/ photos
Sea Surface Temperature Mapping
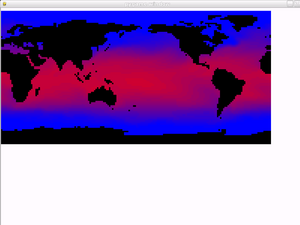
Sea surface temperature mapping Inspired by http://oceanpc.org this reads temperature data available at http://www.ncdc.noaa.gov/oa/climate/research/sst/sst.html more ideas at http://marinedataliteracy.org/index.html
The data format is described at ftp://eclipse.ncdc.noaa.gov/pub/ersstv3b/README
The first record in the file ersst_v3b_2010_2019.asc , the 2010 to 2019 data set, reads:
-9999 -9999 -9999 -9999 -9999 -9999 -9999 -9999 -9999 -9999 -19 13 18 11 7 25 64 132 255 427 607 791 990 1198 1408 1616 1816 1999 2149 2258 2327 2360 2365 2355 2347 2359 2393 2443 2500 2568 2654 2736 2789 2826 2869 2904 2911 2903 -9999 -9999 -9999 -9999 -9999 -9999 -9999 -9999 -9999 -9999 -9999 -9999 -9999 -9999 -9999 1489 1432 -9999 -9999 -9999 -9999 -9999 713 -9999 656 715 780 796 744 669 596 476 298 156 113 70 -134 -180 -180 -180 -180
-9999 represents land, the other numbers are degrees C x100 This record represents a line running from the south pole through to the north pole in 2 degree increments at longtitude 0 for the first month and year. The next record is for lattitude 2 degrees east and so on.
Challenges
- Display the other months and years in the file
- Display the month and year in the title bar
- Animate the display
- Do a legend
- Display the temperature at the cursor
- Map other data
- Error checking
- Display partly corrupted data sets without crashing
- Create models of ocean or atmosphere
File:Write Activity sst.odt Pippy code as open office doc


