Activities/Graph Plotter
Jump to navigation
Jump to search
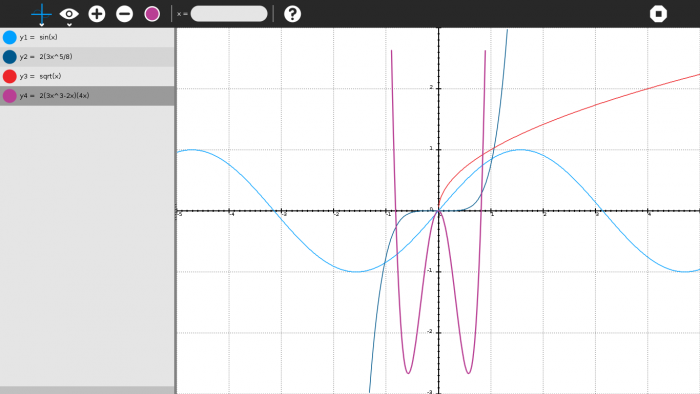
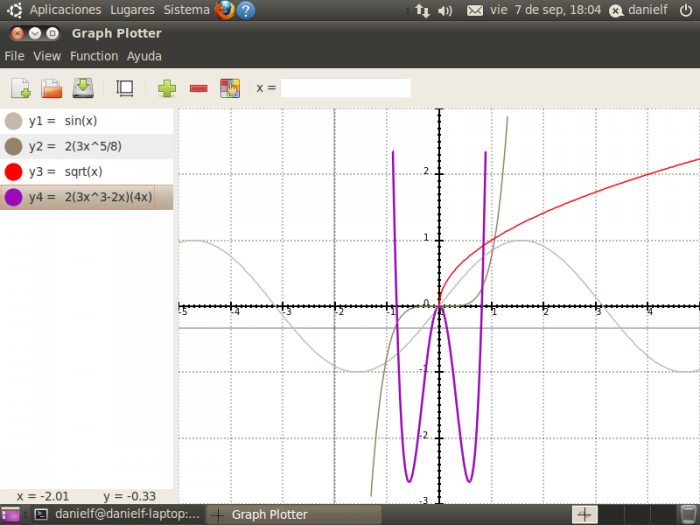
Graph Plotter is an activity to plot mathematical functions easily.
History
The starter idea was from Ana Cichero, a maths teacher from Uruguay. Here students can't pay an expensive calculator, but their little siblings have XO computers and she needed an activity easy to use where her students can do their homework or revise previous than their tests. Now there are advanced students with XO computers and this activity is very useful for them.
Download
Desktop Version
File:GraphPlotterDesktop.tar.gz See Graph Plotter#Running_Graph_Plotter_on_other_Linux_environments for more information.
Running Graph Plotter on other Linux environments
Dependencies:
python-rsvg
python-numpy
Steps:
- Downolad and extract the file File:GraphPlotterDesktop.tar.gz.
- Open the extracted dir and run the install script.
Instead the last step, by the console you can type:
make local

