Difference between revisions of "Activities/Analyze"
m (moved Walter is a wanker 7/Analyze to Activities/Analyze over redirect: revert) |
|||
| Line 90: | Line 90: | ||
* [http://activities.sugarlabs.org/en-US/sugar/addon/4200 Activity bundle] | * [http://activities.sugarlabs.org/en-US/sugar/addon/4200 Activity bundle] | ||
| − | * [http://git.sugarlabs.org/projects/analyze | + | * [https://github.com/quozl/analyze-activity source repository at GitHub] |
| + | * [http://git.sugarlabs.org/projects/analyze source repository at Gitorious] | ||
* Tickets in Trac: [http://dev.laptop.org/query?status=assigned&status=new&status=reopened&groupdesc=1&group=milestone&max=150&component=analyze-activity&order=id&col=id&col=summary&col=status&col=owner&col=type&col=next_action&col=changetime OLPC] | * Tickets in Trac: [http://dev.laptop.org/query?status=assigned&status=new&status=reopened&groupdesc=1&group=milestone&max=150&component=analyze-activity&order=id&col=id&col=summary&col=status&col=owner&col=type&col=next_action&col=changetime OLPC] | ||
Revision as of 18:50, 22 December 2016
What is Analyze?
Analyze is an Activity that displays your networking, X (graphical) display, and presence service status. It is useful to developers, testers and end-users as an easy way to monitor and submit data for monitoring/debugging networking/X issues.
Using Analyze
Analyze is a very simple Activity. All that you do is tell it what interface you want it to display information from.
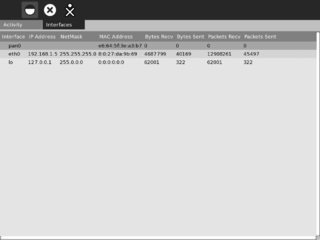
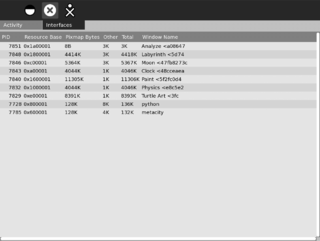
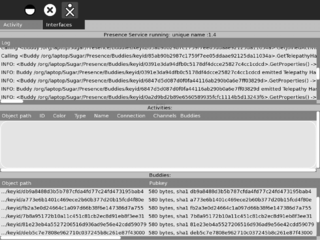
To select an interface, click on the "Interfaces" tab at top, and then on the appropriate Interface icon (by default, Analyze will start in the Network Status screen). Here are (from left to right) the Network Status, X Server, and Presence Service interface icons.
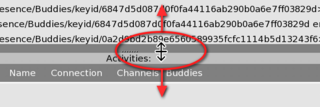
Note that the Presence Service screen has 3 windows. You can drag the window boundaries up and down to resize the area of each sub-display.
Features
Network Status interface
This interface displays network interface data from /proc/net/dev. You should see the following information:
- interface name
- IP address
- netmask
- MAC address
- bytes received
- bytes sent
- packets received
- packets sent
X Window interface
This interface displays X window information from the libXres extension. You should see the following information:
- X window names
- PIDs
- resource base
- pixmap bytes
- memory usage (other/total)
Presence Service interface
This interface displays Presence Service information, getting data directly from Dbus. It has 3 sections: the presence service event log, Activities (on your Neighborhood) and Buddies (in your Neighborhood).
Presence service event log
The top section of the Presence Service interface is a log of recent presence service events.
Activities (on your Neighborhood)
The middle section of the Presence Service interface is a list of shared Activities visible in Neighborhood view, with the following information for each:
- object path
- ID
- color
- type
- name
- connection
- channels
- buddies
Buddies (in your Neighborhood)
The middle section of the Presence Service interface is a list of shared Activities visible in Neighborhood view, with the following information for each:
- object path
- pubkey
- nick
- owner
- color
- IPv4
- current activity
- Activities
- handles
Resources
- Activity bundle
- source repository at GitHub
- source repository at Gitorious
- Tickets in Trac: OLPC


